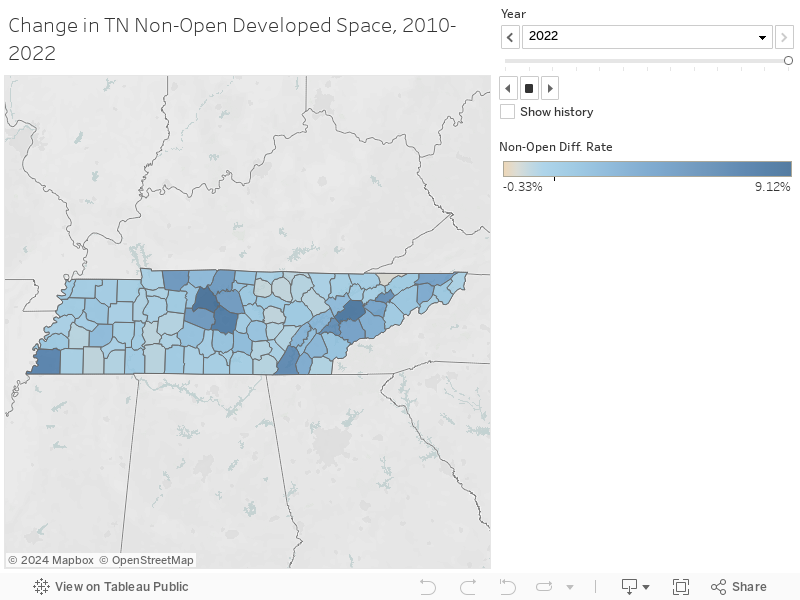
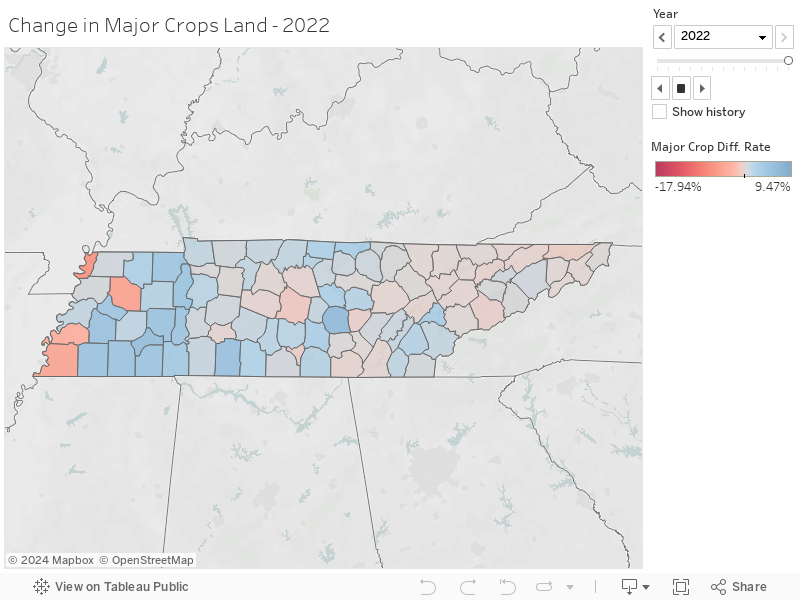
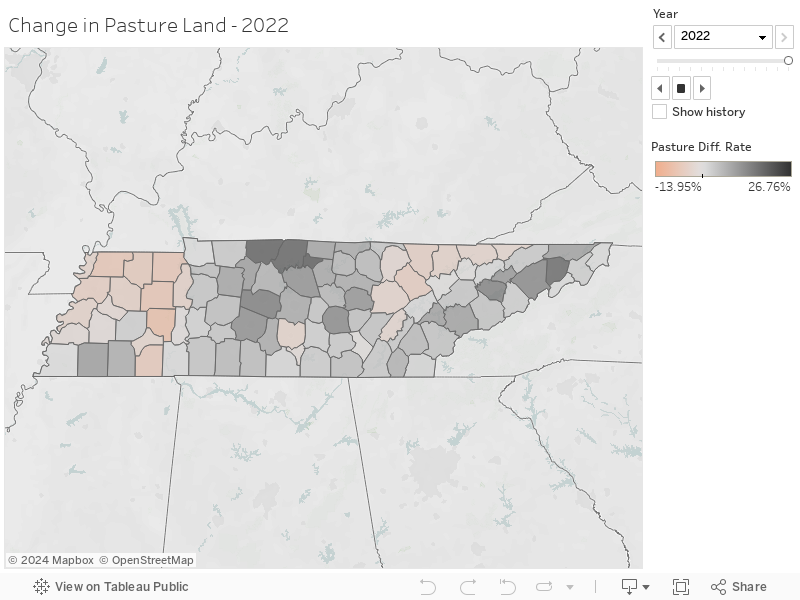
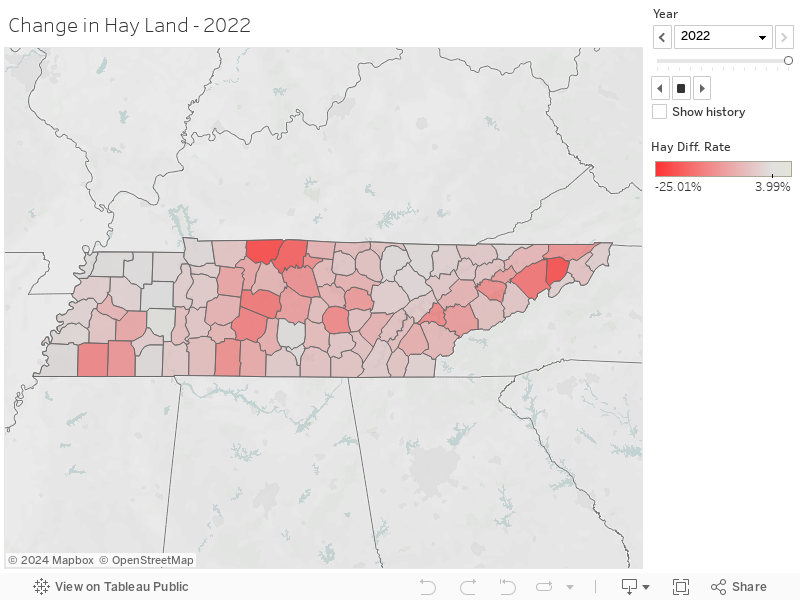
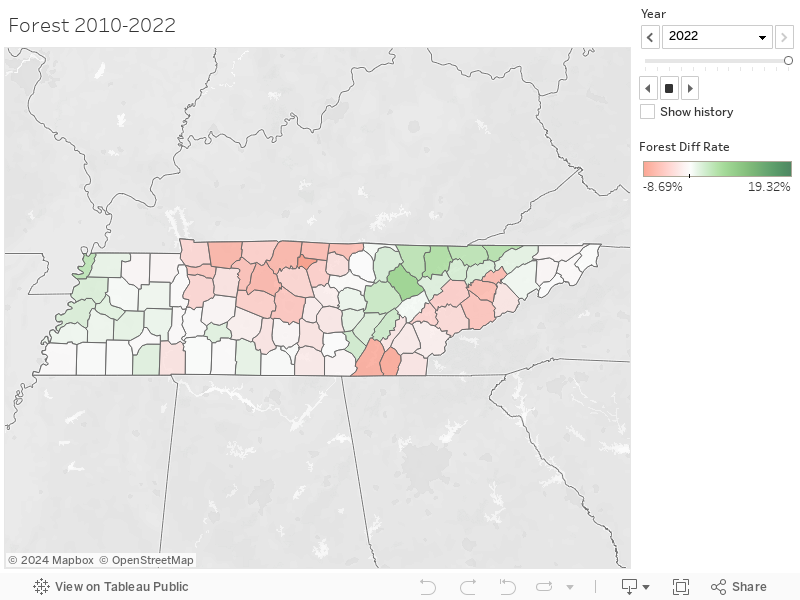
These interactive dashboards displays the percentage change in land cover since 2010 for each county in Tennessee. The data used to create these dashboards came from the USDA CropsScape Datalayer. We have classified this data into 5 categories. Cropland includes all annual row crop production; pasture includes pasture for grazing, hay is acres used to cut hay, non-open developed is all residential, commercial, and industrial development, and forest is all acres covered in timber. The data from these dashboards can also be downloaded.
The dashboards presented below when viewed on a mobile device are best viewed landscape.
The county links below contain maps and tables that show a more in-depth analysis of the agricultural, farm, and forestry land conversion for the counties in Tennessee. The data for these maps was provided by the Tennessee Comptroller of the Treasury and county property assessors.
Click on a County for a printable PDF version of the Land Loss data
If you have any questions, email Dr. Charley Martinez (cmart113@utk.edu).